
Mind map, Timeline, Chart and Spreadsheet views
Four views leave “coming soon”: a mind map you can rearrange by dragging, a timeline, live charts and a real spreadsheet.
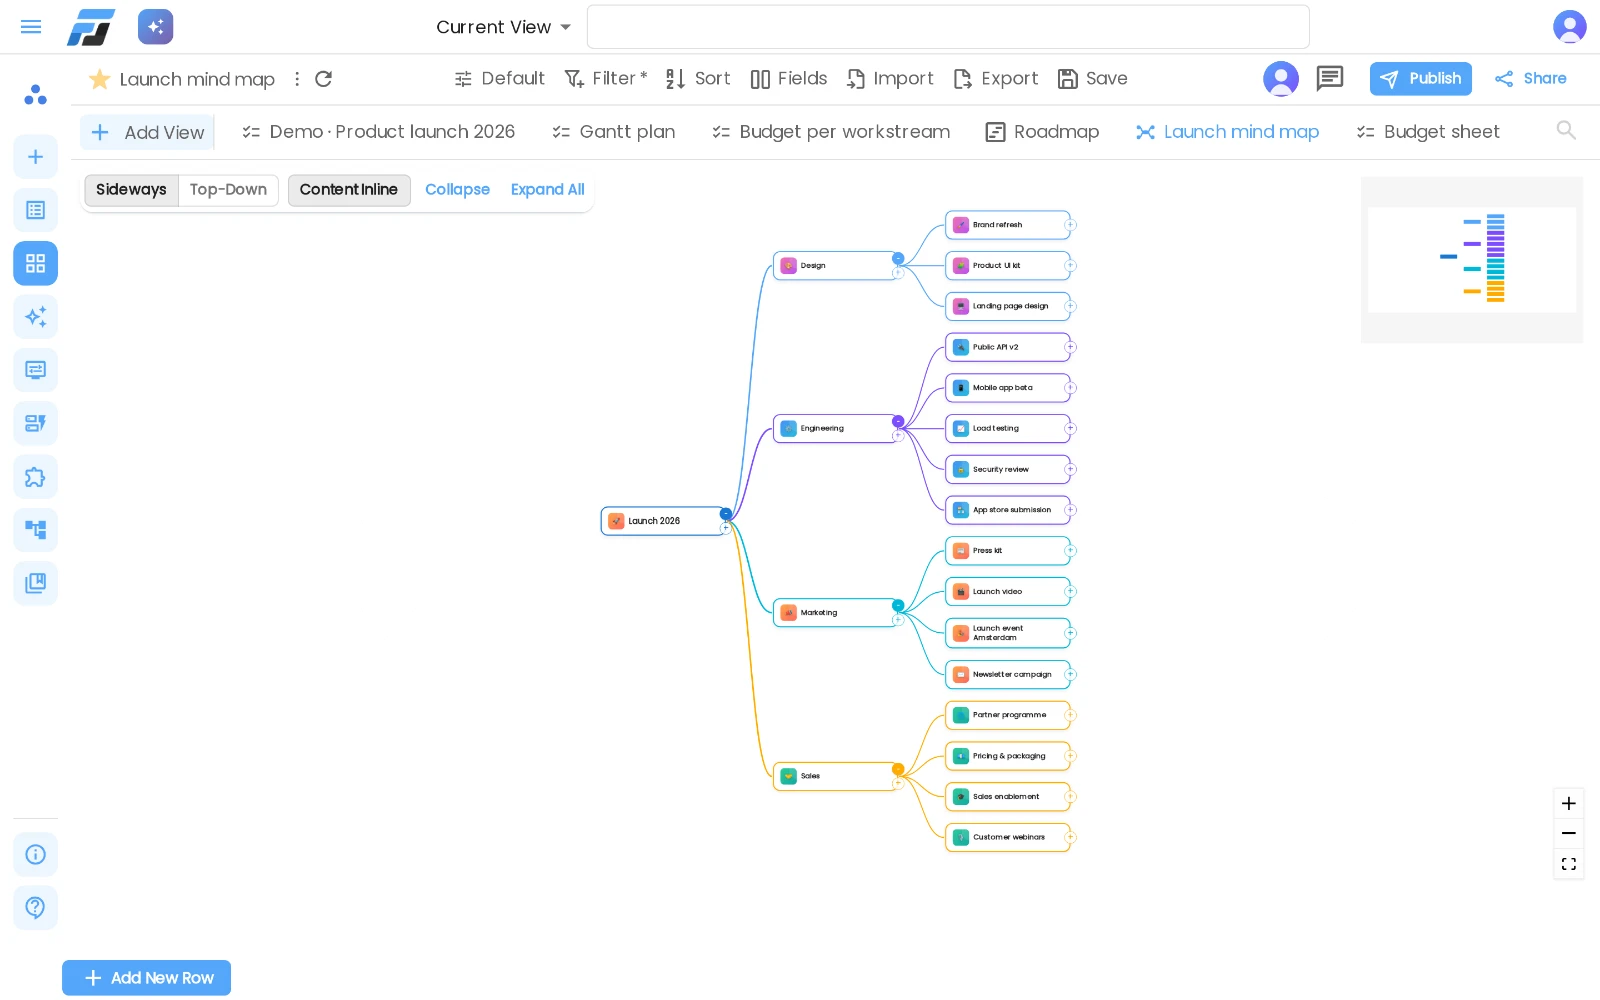
This week four views graduated from “coming soon” to everyday tools.
Mind map
Pick a name field and a parent field, and your list becomes a tree — an org chart, a product structure, a set of ideas. Drag a node onto another to give it a new parent; the row updates. Parents that don’t exist as rows yet show up as their own nodes, so half-finished lists still make a sensible map.
Timeline
Rows with a start and end date, laid out over time and grouped per person or project. Gaps and clashes jump out.
Chart
Bar, line and pie charts built straight from your list. They follow your filters, so the chart is always about the rows you’re looking at.
Spreadsheet
Type, paste from Excel or Google Sheets, move with the keyboard. When you just need to fill in a hundred cells, this is the view.
Also this week
- Every workspace now runs its own isolated AI account, so one team’s work never mixes with another’s.
- People you share a workspace with now work inside that workspace.
- Image and file downloads with commas or accents in their names now work everywhere.